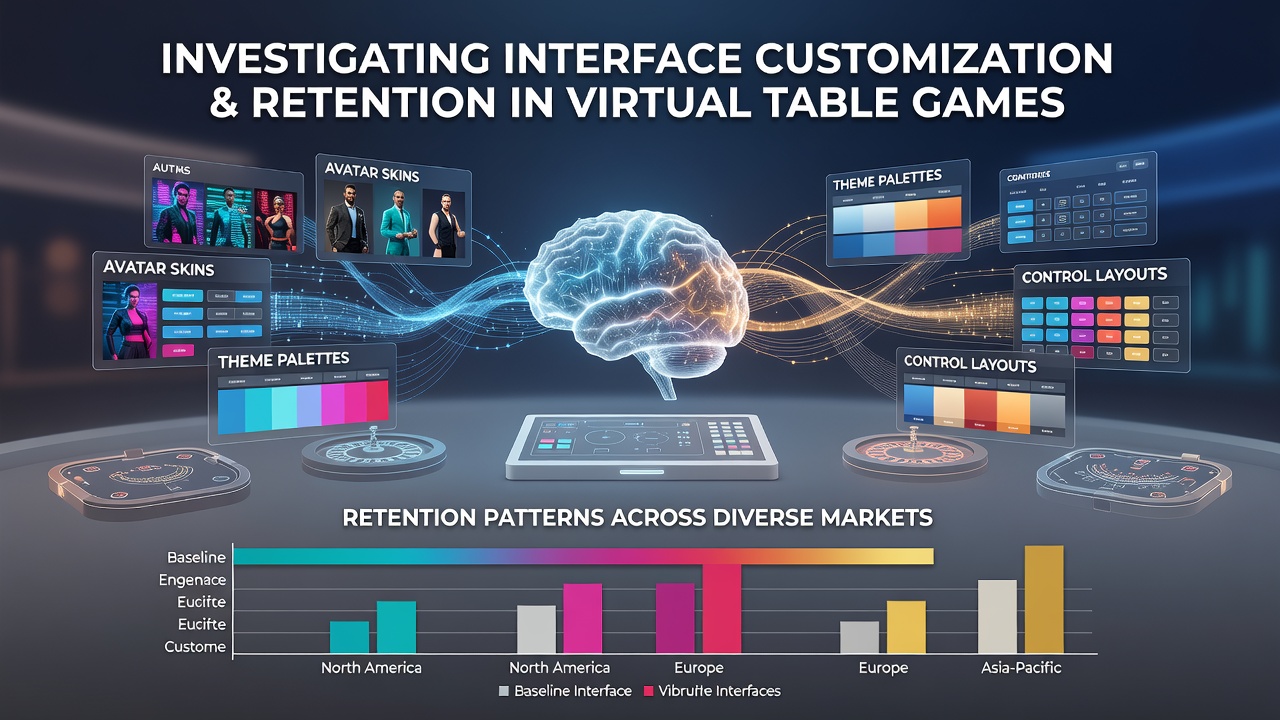
Interface Customization Reshapes Retention in Virtual Table Games Across Global Markets
Virtual table games continue to evolve as operators introduce more interface customization tools, and data from multiple regions shows these options correlate with changes in how long players stay engaged. Research conducted across North American and Asian markets indicates that players who adjust elements like table themes, card backs, and betting layouts tend to log longer sessions than those using default settings. In August 2026, reports from several platforms noted a measurable uptick in repeat logins among users who modified at least three interface elements within their first week.
Regional Differences in Customization Adoption
Markets in Europe and North America display distinct patterns compared with those in Asia when it comes to which features players choose to alter. European users often prioritize speed controls and simplified layouts, while participants in Singapore and Macau markets adjust visual elements such as background colors and chip designs at higher rates. Data compiled by the Macau Gaming Inspection and Coordination Bureau reveals that customized sessions in virtual blackjack and baccarat produced retention rates roughly 18 percent higher than standard sessions during the first half of 2026.
Operators have observed that players in Canada respond strongly to sound toggles and animation speed sliders, and a study released by the Ontario Lottery and Gaming Corporation links these options to extended play periods across poker and roulette titles. The same study notes that users who disabled background music while enabling quick-deal animations showed the strongest increase in weekly active days.
Technical Features Driving Engagement
Customization extends beyond appearance to include layout memory, auto-adjusting bet sizes, and preferred camera angles during live dealer streams. Platforms that store these preferences across devices report smoother transitions between mobile and desktop play, which correlates with fewer drop-offs mid-session. One analysis of European interactive gaming traffic found that accounts with saved custom layouts maintained activity levels 22 percent longer over a 90-day window than accounts without stored settings.

Live dealer interfaces have incorporated player-controlled zoom levels and multi-camera switching, and retention data from operators in New Jersey shows these controls reduce early exits during peak evening hours. When players can switch between overhead and close-up views without leaving the table, session duration increases noticeably, particularly in markets where average connection speeds support high-resolution streaming.
Data Patterns Across Age Groups and Device Types
Younger demographics in Australia and the United Kingdom demonstrate higher engagement with advanced customization panels that include statistical overlays and historical hand tracking, whereas older cohorts tend to favor minimal changes focused on readability adn larger buttons. Device type also influences outcomes, with tablet users adjusting screen orientation and split-view options more frequently than smartphone players, leading to different retention curves depending on hardware.
Operators tracking these variables note that cross-device continuity of custom settings produces the most consistent retention gains. When a player sets a preferred dealer speed on a phone and finds the same speed applied on a laptop the next day, return rates climb across the measured period.
Conclusion
Interface customization continues to influence retention patterns in virtual table games, with measurable differences appearing across regions, age groups, and device types. Platforms that expand these options while maintaining performance stability see corresponding shifts in how players return and how long they remain active. As more markets release updated player data through 2026, the relationship between choice architecture and session metrics remains a central focus for operators seeking to align product design with observed behavior.